Overview
For a fun afternoon project, how about a retro prometheus exporter using Apache/nginx, cgi-bin and bash!?

About prometheus format
A Prometheus exporter simply has to return a page with metric names and metric values in a particular format like below.
ntnx_bash{metric="cluster_read_iops"} 0
ntnx_bash{metric="cluster_write_iops"} 1
When you configure prometheus via prometheus.yml you’re telling prometheus to visit a particular IP:Port over HTTP and ask for a page called metrics – so if the “page” called metrics is a script – the script just has to return (print) out data in the expected format – and prometheus will accept that as a basic “exporter”. The idea here is to write a very simple exporter in bash that connects to a Nutanix cluster – hits the stats API and returns IOPS data for a given container in the correct format.
Where to put this script
By default, prometheus will look for a /metrics URL on the IP/Port given in prometheus.yml In this config file the bash script is running on the same host as the prometheus scraper (hence localhost) but it could be anywhere.
To keep the config simple, we just use port 80 and setup a standard apache/nginx server – we name the file /var/www/html/metrics – so when prometheus hits localhost:80/metrics or simply localhost/metrics from a browser – the bash script will execute and return the results in the required format.
prometheus.yml snippet
    static_configs:
      - targets: ["localhost:9090", "localhost:80"]
How to get cgi-bin to work on modern web-servers
We need to convince nginx to allow cgi-bin to work with a bash script.
- Install fastcgiwrapper
sudo apt install fcgiwrap - Include this in
/etc/nginx/sites-enabled/defaultunderServer– we use/since we need the URL of the script to be/metrics
server {
    listen 80 default_server;
    listen [::]:80 default_server;
...
    location ~ / {
        root /var/www/html/;
        include /etc/nginx/fastcgi_params;
        fastcgi_pass unix:/var/run/fcgiwrap.socket;
        fastcgi_param SCRIPT_FILENAME /var/www/html$fastcgi_script_name;
    }
...
}
Basically the bash script does this if we run it – It must output the header “Content-Type: text/plain” else prometheus/web-browser won’t recognize the content.
gary@linux:~$ bash /var/www/html/metrics
Content-Type: text/plain

ntnx_bash{metric="cluster_read_iops"} 0
ntnx_bash{metric="cluster_write_iops"} 1
Using it
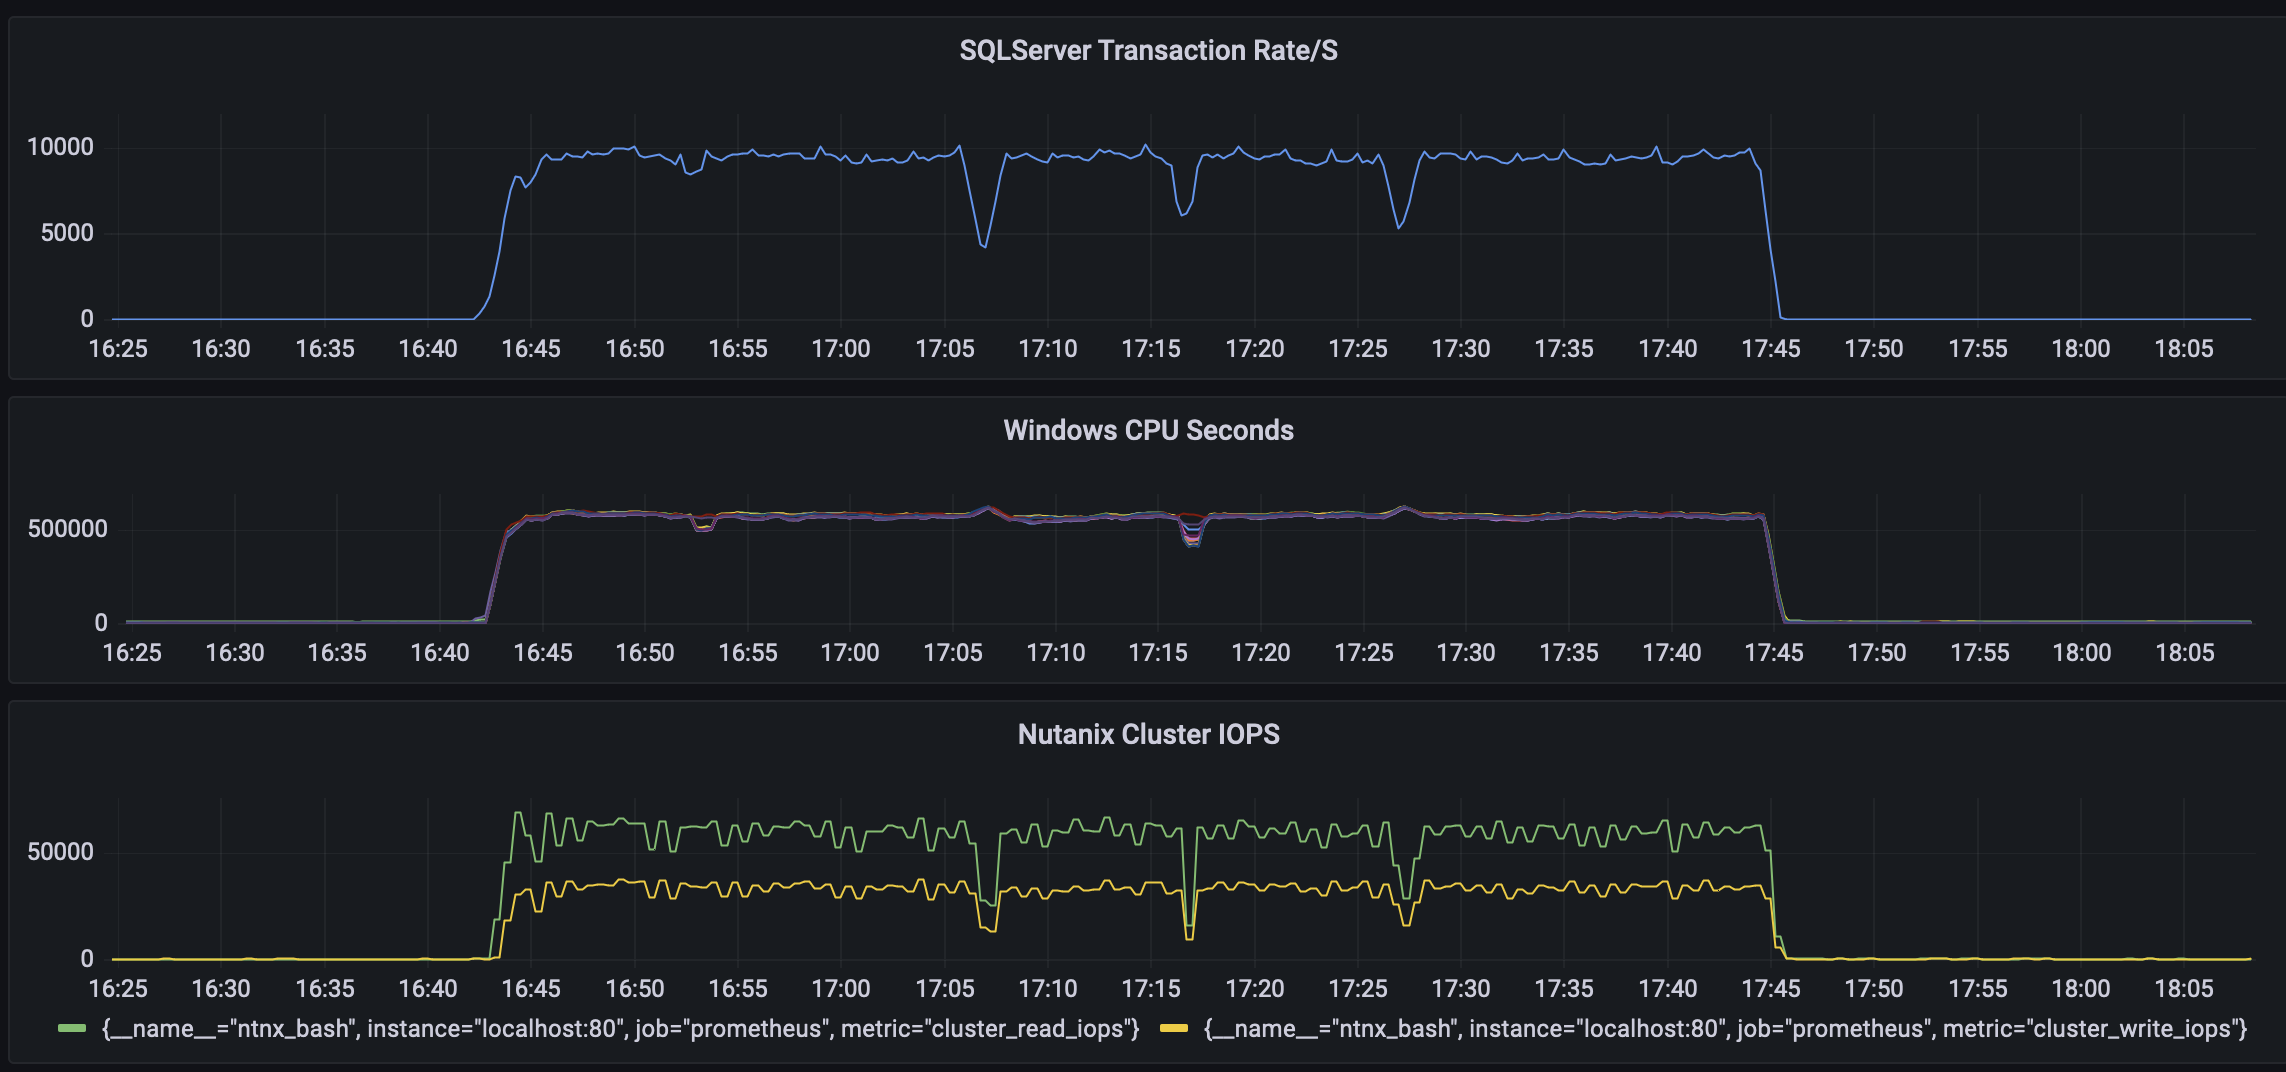
Now we can get cluster stats and combine them with a Windows/SQL-Server exporter and view them using grafana or similar. In this example – I am running HammerDB with the TPRO-C (TPC-C Like) workload running on a Nutanix node.

Here is what HammerDB shows. Note that HammerDB shows transactions per minute whereas the exporter gives us transactions per second.

The Script
gary@linux:~$ cat /var/www/html/metrics
#!/usr/bin/env bash

# IP here is the cluster VIP
VIP="<cluster virtual IP>"
username="admin"
password="<somepassword>"
container_list="<a_container_name_or_list_of_containers>"

function main {
    printf "Content-Type: text/plain\n\n"
        for container in $container_list ; do
            CTR_UUID=$(get_uuid_for_container $container)
            READ_IOPS=$(get_metric $CTR_UUID "controller_num_read_iops")
            WRITE_IOPS=$(get_metric $CTR_UUID "controller_num_write_iops")
            echo "ntnx_bash{metric=\"cluster_read_iops\"} $READ_IOPS"
            echo "ntnx_bash{metric=\"cluster_write_iops\"} $WRITE_IOPS"
        done
}

function get_metric {
    CTR_UUID=$1
    metric_name=$2
    URL="https://$VIP:9440/PrismGateway/services/rest/v2.0/storage_containers/$CTR_UUID/stats/?metrics=$metric_name"
    JSON=$(curl -S -u "$username:$password" -k -X GET --header 'Accept: application/json' $URL 2>/dev/null)
    RES=$(echo $JSON | jq '.["stats_specific_responses"][0]["values"][0]')
    echo "$RES"
}

function get_uuid_for_container {
    CTR_NAME=$1
    URL="https://$VIP:9440/PrismGateway/services/rest/v2.0/storage_containers/?search_string=$CTR_NAME"
    JSON=$(curl -S -u "$username:$password" -k -X GET --header 'Accept: application/json' $URL 2>/dev/null)
    RES=$(echo $JSON | jq '.["entities"][0]["storage_container_uuid"]'| sed s/\"//g)
    echo $RES
}
# Call main function.
main

