
TL;DR
- Enable SQLServer agent in SSMS
- Install the Prometheus Windows exporter from github the installer is in the Assets section near the bottom of the page
- Install Prometheus scraper/database to your monitoring server/laptop via the appropriate installer
- Point a browser to the prometheus server e.g.
:9090 - Add a new target, which will be the Windows exporter installed in step.
- It will be something like <SQLSERVERIP>:9182/metrics
- Ensure the Target shows “Green”
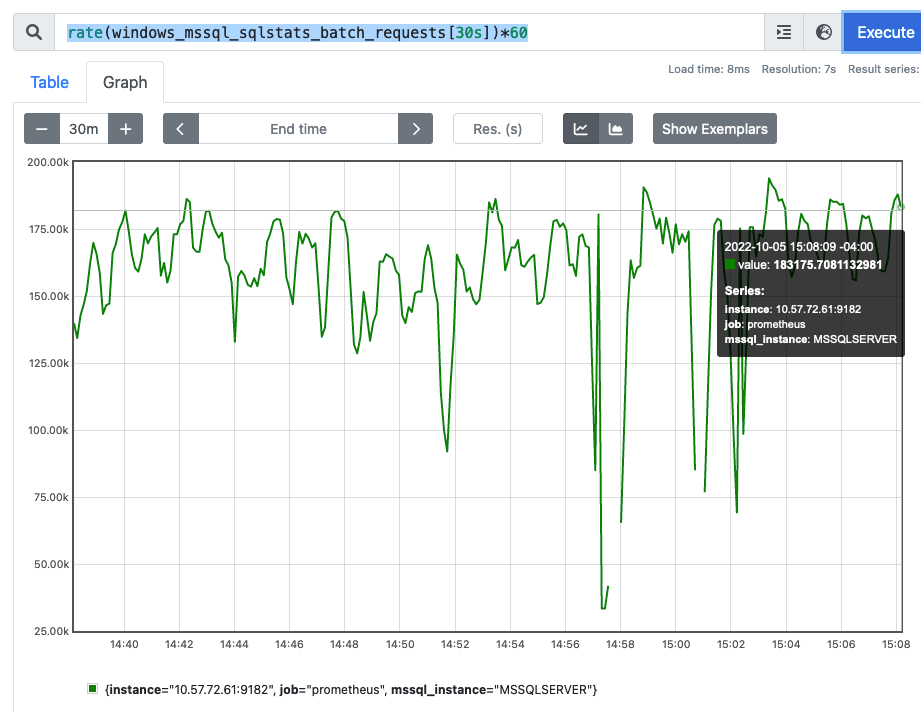
- Check that we can scrape SQLserver tranactions. In the search/execute box enter something like this
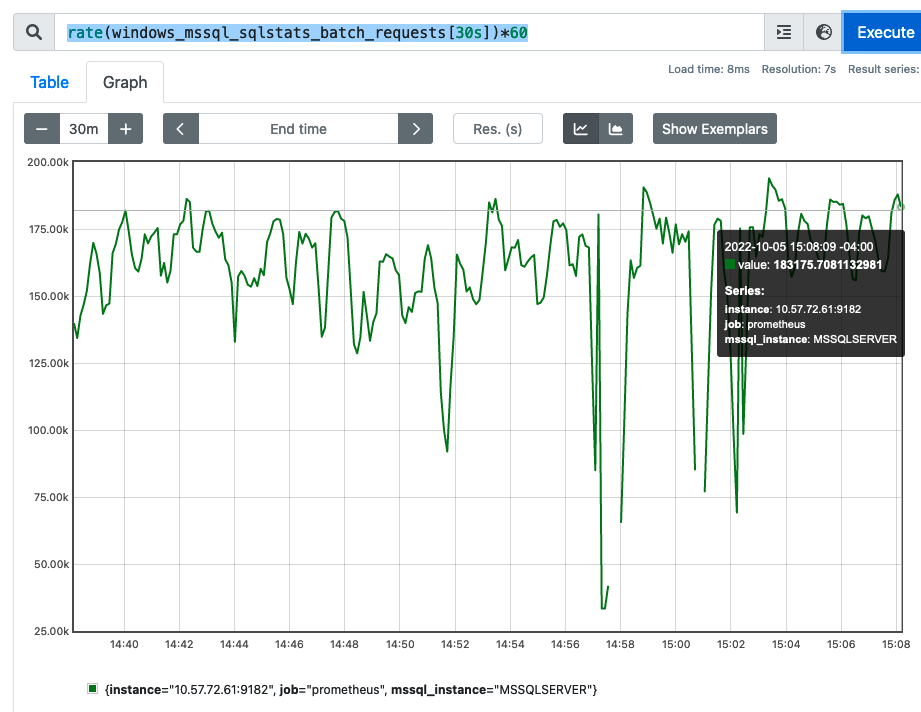
rate(windows_mssql_sqlstats_batch_requests[30s])*60 - Put the SQLserver under load with something like HammerDB
- Hit Execute on the Prometheus server search box and you should see a transaction rate similar to HammerDB
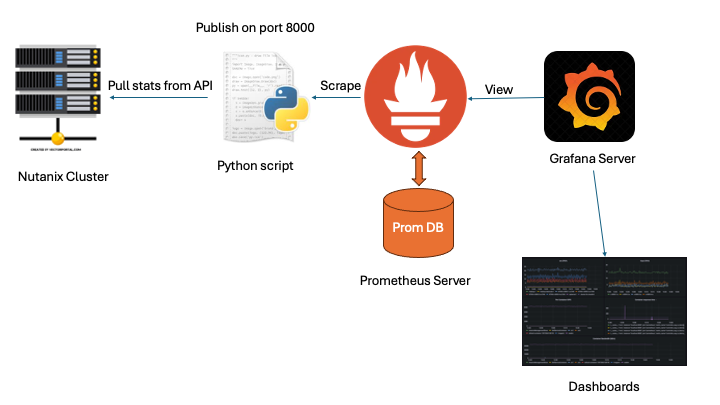
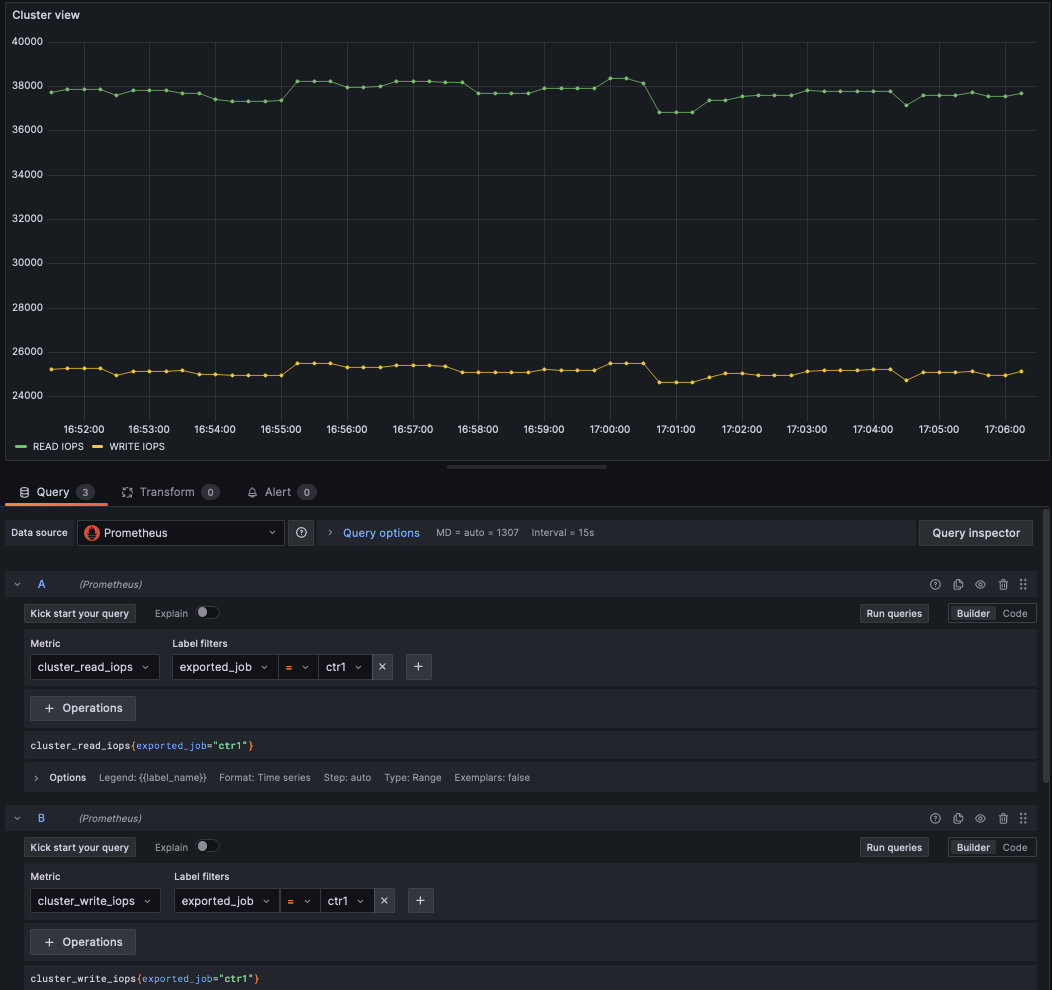
- Install Grafana and Point it to the Prometheus server (See multiple examples of how to do this)
Detailed Instructions and description
1 Enable SQL Server Agent in SSMS
This allows external collectors to query the SQL Server engine. In this case the collector will be the Prometheus exporter. The SQL Server agent is the component that allows this interaction to happen.
You will need to change the startup type for the SQL Server Agent service to “Automatic” in the properties section of the SQL Server Agent Service if you want the agent to (re)start at boot. Which is probably what you want.

2 Install the Prometheus exporter for Windows
Next we need to install a Prometheus exporter to the Windows machine that hosts the database. This exporter is the component that Prometheus will connect to in order get information on SQLserver activity.
It turns out that the default Windows node exporter includes basic SQL Server metrics like transactions. There is no need to install additional exporters. There are pre-built MSI installers, so there is no need to compile from source unless you want to.
All the files for the windows exporter are stored on GitHub. You won’t find the installers on the initial landing page. The binary MSI installers are shown only from the release page. e.g. the main page will not show you the binary downloads. Click on the ‘Latest” and then navigate to “Assets”. The graphic below is shown on the front page and is a link to the specific release identified. This is where the installers reside.

- Download and run the installer The installer will put the binary in `C:\Program Files\windows_exporter’.
- Check to see if there is a process/task names “windows_exporter” running. Kill it if it is because we need to start the collector manually with some additional flags.
- You need to run with non default flags in order to scrap the SQLserever statistics
"C:\Program Files\windows_exporter\windows_exporter.exe" --collectors.enabled="os,cpu,mssql"should do the job - Use
Task Managerto see if it is running or not. - On the Windows machine, use a browser to navigate to
http://localhost:9182/metrics– If the exporter is running you will see a list of available metrics. - To make the non-default settings permanent the next time the collector restarts or the system reboots add these flags to the registry at “HKEY_LOCAL_MACHINE\SYSTEM\CurrentControlSet\Services\windows_exporter”. Set the ImagePath value to something similar to below
"C:\Program Files\windows_exporter\windows_exporter.exe" --collectors.enabled="os,cpu,mssql" --log.format logger:eventlog?name=windows_exporter
With your browser pointed to http://localhost:9182/metrics You should see Prometheus internal metrics, Windows OS metrics and SQL server metrics.
go_gc_duration_seconds{quantile="0"} 0
go_gc_duration_seconds{quantile="0.25"} 0
...
windows_cpu_processor_performance{core="0,0"} 3.4526666335e+11
windows_cpu_processor_performance{core="0,1"} 3.63210299362e+11
...
# TYPE windows_mssql_sqlstats_batch_requests counter
windows_mssql_sqlstats_batch_requests{mssql_instance="MSSQLSERVER"} 1.1222868e+07
3 Install Prometheus / setup scraper
After installing the collector/exporter we need to setup something to collect the metrics that are being exported from Windows/SQLserver. Typically the collector runs on a separate machine than the one running the SQL Server. I normally use either a Mac or a Linux box. So, switching to wherever you want to consume the metrics we need to install Prometheus itself. Once Prometheus is installed we need to tell it where the SQLserver is running and exporting metrics. In my example this is a Mac.
- Download the appropriate
tgzfile from prometheus.io. There is a binary inside, Copy thetgzto wherever you want to run Prometheus from. - Extract the
tgzand execute the binary./prometheus - Add the Windows Host as a target in the prometheus.yaml file. Remember that the Windows exporter is exporting on port
9192. In this instance my Windows host is at10.57.72.61.
    static_configs:
- targets: ["localhost:9090","10.57.72.61:9182"]- Start Prometheus scraper on the Mac
<INSTALL-DIR>/prometheus - Point a Web browser at
localhost:9090. In the Status->Targets tab, you should see the exporter on10.57.72.61:9182/metricswith StateUP - In the graph tab add
rate(windows_mssql_sqlstats_batch_requests[30s])*60– This figure should match what HammerDB shows in the “TPM window. We multiply by 60 because rate() gives us per second over 30s and we want per minute to match HammerDB - (Not Shown on chart). Consuming Windows CPU core time
100*sum(rate(windows_cpu_time_total{mode!="idle"}[5m])) by (core)
Prometheus SQLServer Batch TPM

Hammer DB TPM


