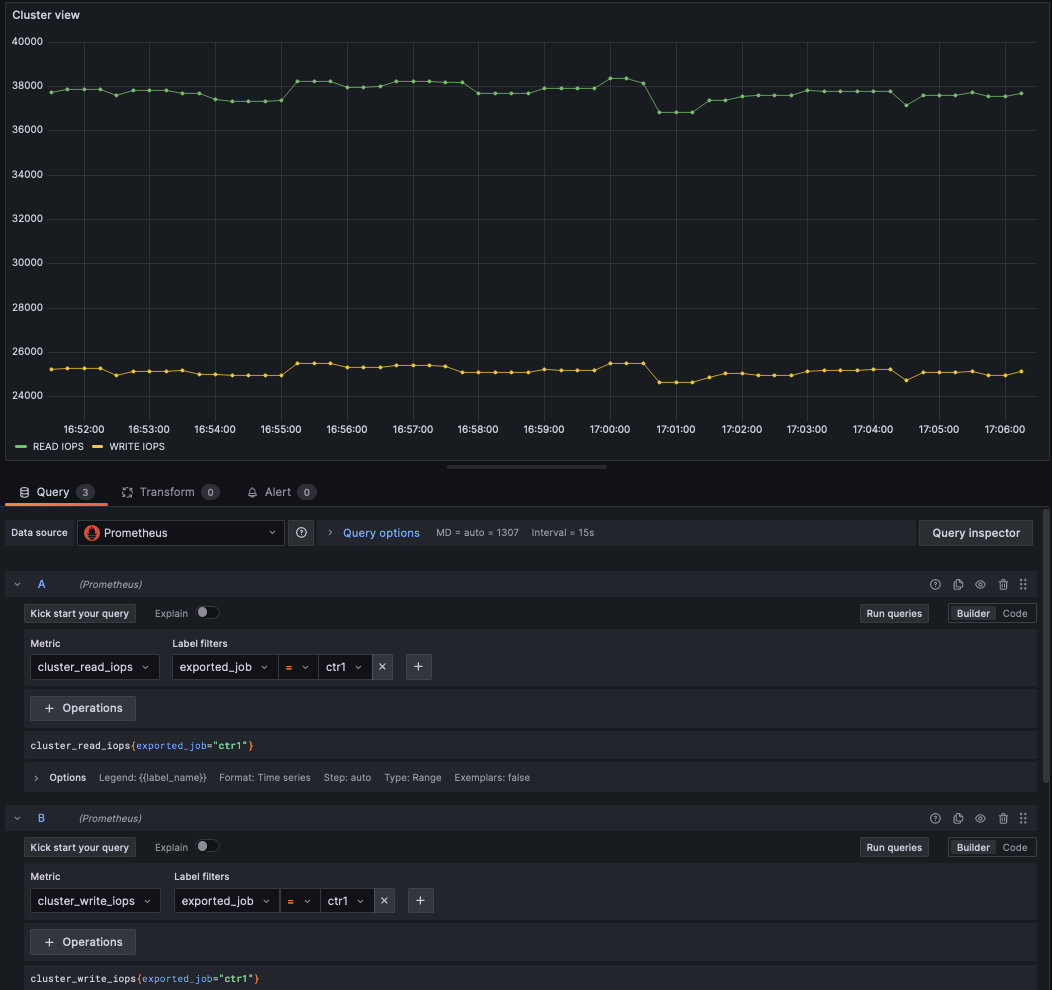
Using Nutanix API with prometheus push-gateway.
Many customers would like to view their cluster metrics alongside existing performance data using Prometheus/Grafana
Currently Nutanix does not provide a native exporter for Prometheus to use as a datasource. However we can use the prometheus push-gateway and a simple script which pulls from the native APIs to get data into prometheus. From there we can use Grafana or anything that can connect to Prometheus.
The goal is to be able to view cluster metrics alongside other Grafana dashboards. For example show the current Read/Write IOPS that the cluster is delivering on a per container basis. I’m hard-coding IPs and username/passwords in the script which obviously is not production grade, so don’t do that.
Continue reading